Performs molecular Monte Carlo simulation of multiple chain protein and single chain nucleic acids.
The Complex Monte Carlo module is accessible from the Simulate section of the main menu.
The purpose of the module is perform a molecular simulation of an multiple chain protein and/or single stranded nucleic acid by sampling backbone torsion angles.
The starting structure must be a complete structure without missing residues. Atom and residue naming must be compatiable with those defined in the CHARMM force field See Notes on Starting Structures and Force Fields and PDB Scan for further details.
The output file format is DCD since in most cases many structures are generated. There is no option to save the output files in PDB format. One can use Extract Utilities to convert DCD files to multi-frame PDB files.
Structures are generated by Markov Monte Carlo sampling of backbone torsion angles. Energetics of torsion angles are determined using CHARMM force field parameters.
While only single chain backbone torsion angles can be sampled, the complete system can have regions that are static and overlap is considered. For example, one can have a composite system of a multi-domain protein, single-stranded DNA ends, along with double stranded DNA (ds-DNA) chains. The ds-DNA chains will not be sampled, but will be can be present and are treated appropriately. Therefore, not all segments need to have move-sets defined, nor do all segments need to be sampled to use this module.
Typically, between 10,000 to 50,000 structures are required to sample adequate configuration space for most problems.
Parameters are supplied to help guide the Monte Carlo sampling such as temperature, control of single move angle sampling per region, and directed Monte Carlo options to guide the radius of gyration (Rg) to a user supplied value.
A utility is provided to overlap accepted structures of each segment onto a single reference frame. This is required to carry out the simulation and is also useful to visualize relative configuration coverage in an ensemble.
Several options are offered to check for atomic overlap: heavy atoms, all, backbone, and atom name. If one chooses the atom name option, then the user will be prompted to supply an atom name that should exist in all residues and a overlap distance cutoff value. Other options set the cutoff distance automatically.
In Advanced Input options are provided to reject structures based on Rg value, position of atoms in the Z-direction and via atomic constraints provided as a list in a text file as described in Constraints. These options are not mutually exclusive and can be used in the same run as needed.
Typical workflows involve generating an ensemble of structures using this module, then energy minimizing the ensemble using Energy Minimization, then calculating scattering from the ensemble using modules in Calculate, and finaly comparing results to experimental data using modules in Analyze.
In many situations, multiple runs need to be carried out to find structures that cover configuration space and have scattering profiles that are in agreement with experimental data. One can use Merge Utilties to combine both the structures (DCD files) and SAS profiles into a single new DCD and single directory will correctly numbered SAS profiles.
To simulate long random coil regions, usually at the ends of globular proteins, it is often neccessary to sub-sample accepted structures as adjacent structures can be correlated. To obtain adequate power-law scaling, one can sub-sample a trajectory using Extract Utitilies using the periodic sampling option.
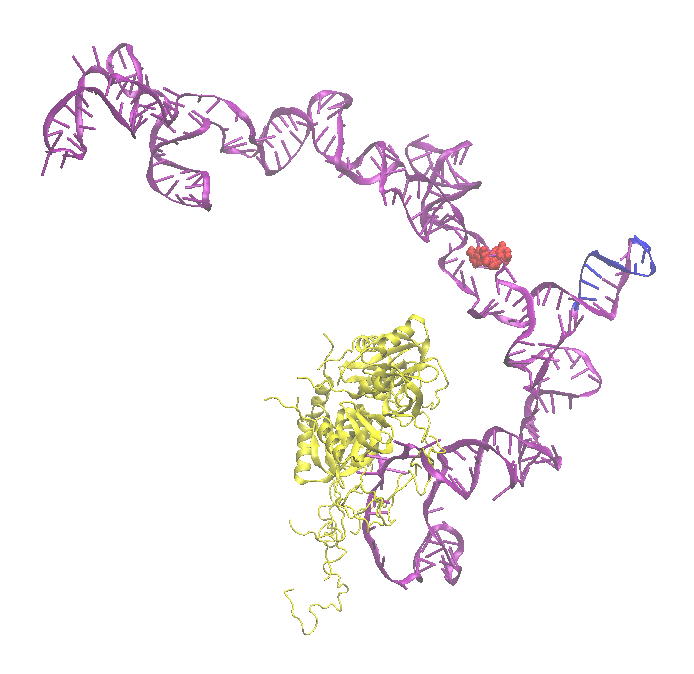
This example generates a series of structures to sample configurations of a rna protein complex. The cartoon of the starting structure highlights the flexible regions (red balls) and structure alignment region (blue). RNA is shown in purple and protein is yellow.
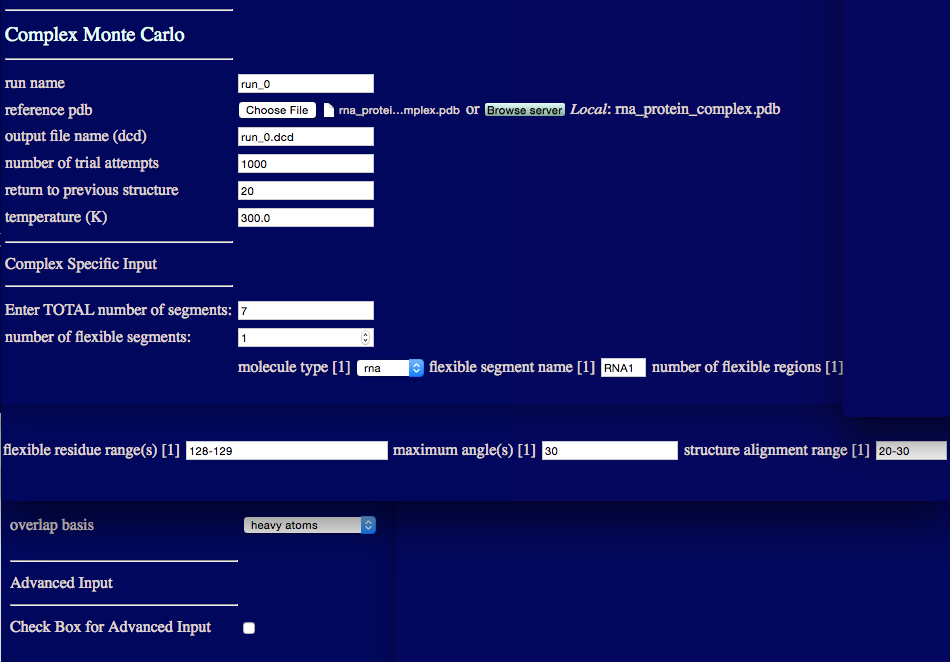
run name user defined name of folder that will contain the results.
reference pdb PDB file with naming information and coordinates of the starting structure.
output file name (dcd) Name of ouput DCD file containing accepted structures from the simulation.
number of trial attempts Number of Monte Carlo moves to attempt.
return to previous structure After this number of Monte Carlo moves fails to find an accepted configuration, re-load a previously accepted structure.
temperature (K) Simulation temperature.
Enter TOTAL number of segments An integer value indicating the number of rigid and flexible segments in the input PDB file.
number of flexible segments An integer value indicating the number of regions to sample backbone torsions.
molecule type Select either protein or RNA.
flexible segment name Name of particular flexible segment .
number of flexible regions An integer value indicating the number of regions to sample backbone torsions.
flexible residue range(s) Residue numbers defining each flexible region in segment. The number of pairs should match the number of flexible regions for the given segment. Pairs of integers separated by hypens with each pair separated by commas.
maximum angle(s) Angle, in degrees, that can be sampled in a single move for each region.
structure alignment range Residue to define the beginning of region used to align structures for the given segment.
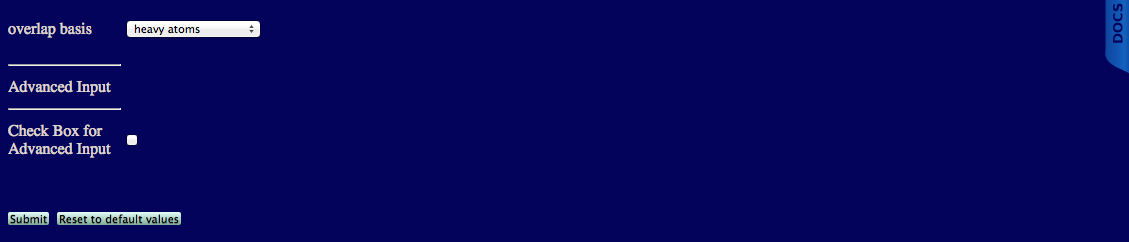
overlap basis Select either heavy atoms, all, backbone or enter atom name. The atom name option will spawn futher inputs:
overlap basis Enter an atom name to check for overlap.
overlap cutoff (angsgtroms) Overlap basis atoms closer than this distance defines an overlap condition.
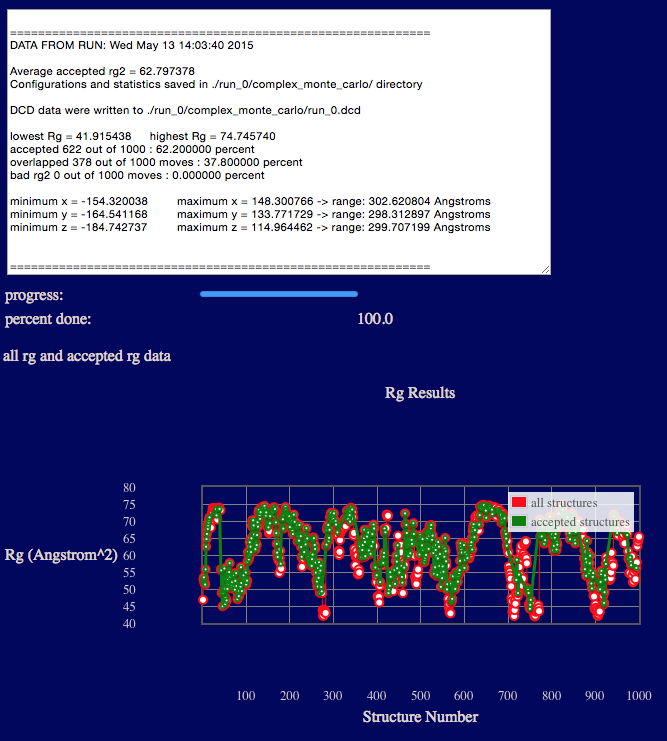
The output will indicate various Rg values from the ensemble, acceptance and overlap statistics, and dimensions of the accepted structures in the final ensemble.
Results are written to a new directory within the given "run name" as noted in the output. In addition, a plot of Rg versus structure number is shown.
Several files are generated and saved to the "run name" monomer_monte_carlo directory. A copy of the original input PDB file, the output DCD file containing accepted structures, files with Rg values as shown in the plot on the web-page, and run statistics.
./run_0/monomer_monte_carlo/rna_protein_complex.pdb

./run_0/complex_monte_carlo/run_0.dcd

./run_0/complex_monte_carlo/run_0.dcd.all_rg_results_data.txt

./run_0/complex_monte_carlo/run_0.dcd.accepted_rg_results_data.txt

./run_0/complex_monte_carlo/run_0.dcd.stats
In the figure below, the original input structure of rna protein complex inside the envelope sampled by accepted structures for a longer complex monte carlo run. The top two density plots represent all accepted structures while the bottom two density plots represent the region of space for structures with reduced chi-square values less than 1.5 (see reference below for more information). The envelope was created using the Density Plot module while filtering against experimental data was carried out using the Chi-Square Filter module. From this diagram one can see that only a subset of structures in a confined set of space are consistent with the experimental SAS data.

input files
output files
run_0.dcd
run_0.dcd.all_rg_results_data.txt
run_0.dcd.accepted_rg_results_data.txt
run_0.dcd.stats
The input variables are listed below.
low Rg cutoff Structures with Rg values less than this value are discarded.
high Rg cutoff Structures with Rg values greater than this value are discarded.
check box to use Z coordinate filter Check box to implement the ability to discard structures with any Z coordinates with a value less than the user supplied Z cutoff value.
directed Monte Carlo (0==no or Rg value) Enter a non-zero value to use an extra energy term in the Monte Carlo sampling to favor Rg values towards the supplied value. The default value is zero which indicates that no bias is implemented.
check box to use atomic constraints Check box to implement the ability to discard structures that do not satisfy the atomic / geometric constraints provided in the user defined constraint file.
The Advanced Input options are used in same way as described in Monomer Monte Carlo.
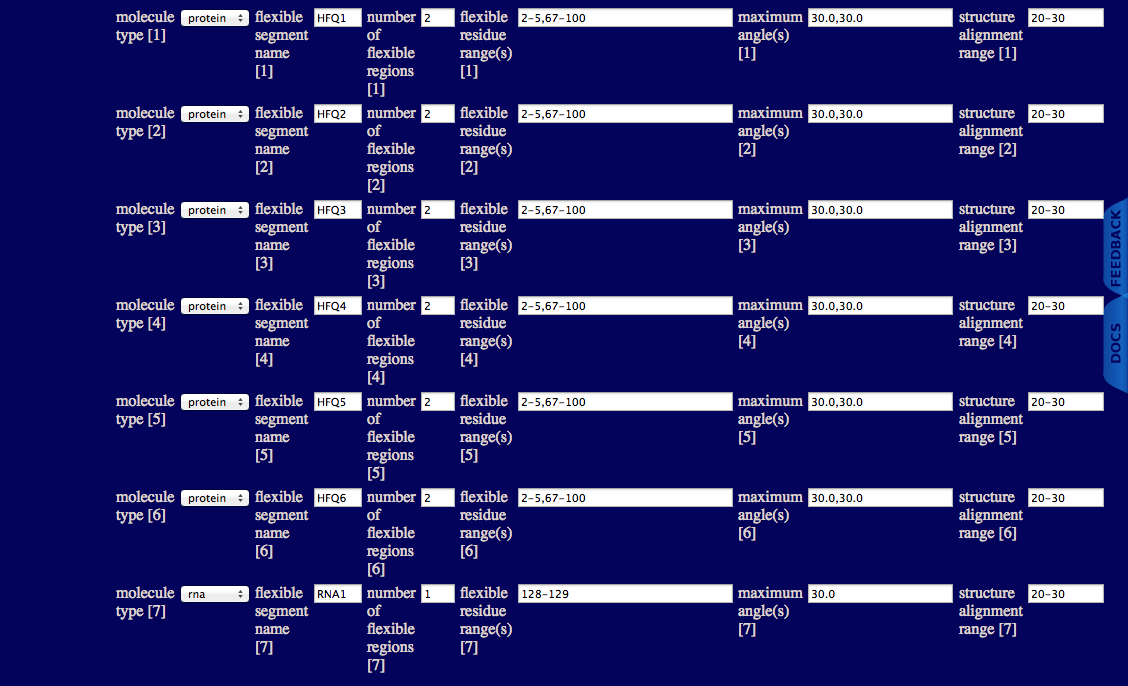
This example uses the same system used above with the additional caveat that you will allow 13 regions be flexible.
The inputs for the run are shown below.
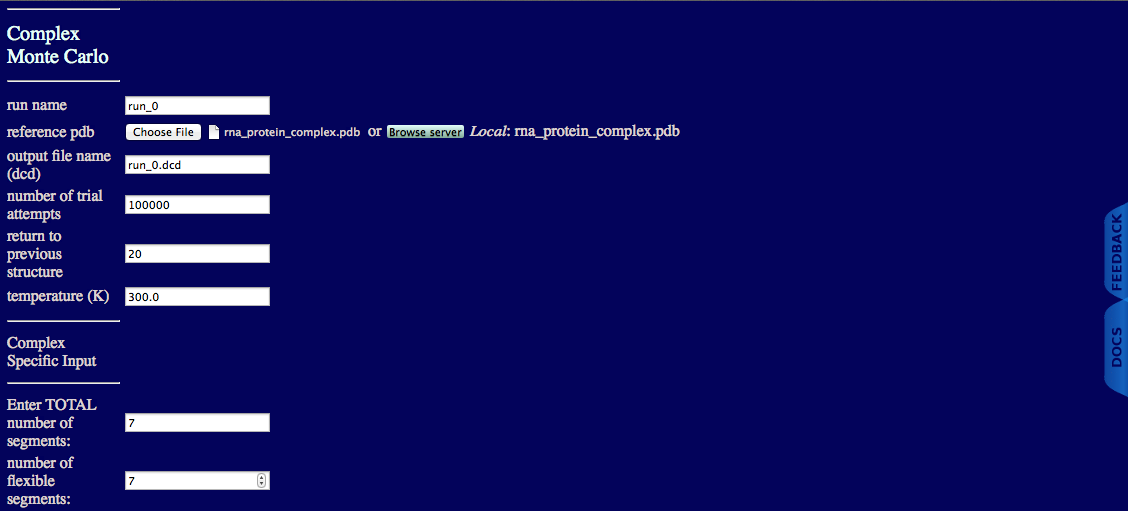
There are six protein segments (HFQ1, HFQ2, HFQ3, HFQ4, HFQ5, HFQ6) and one rna segment (RNA1). Each of the protein segments has both N- and C-terminal flexible regions and the RNA segment has a single flexible regions.
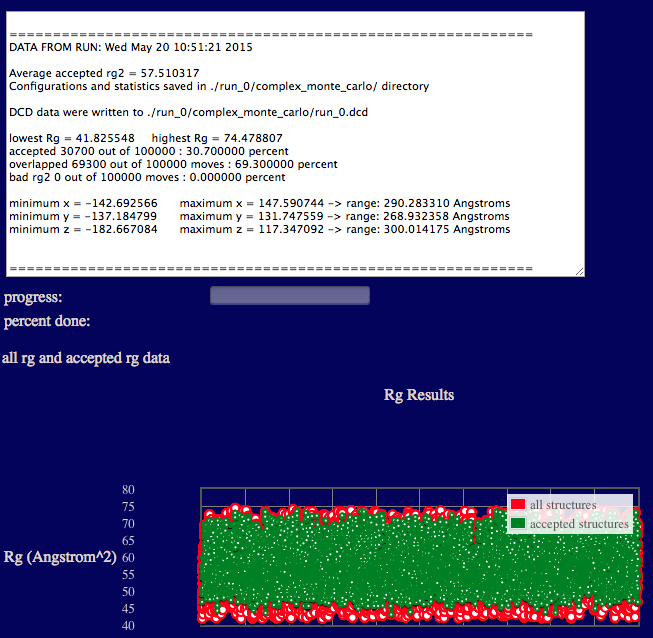
The output will indicate various Rg values from the ensemble, acceptance and overlap statistics, and dimensions of the accepted structures in the final ensemble.
Results are written to a new directory within the given "run name" as noted in the output. In addition, a plot of Rg versus structure number is shown.
Several files are generated and saved to the "run name" monomer_monte_carlo directory. A copy of the original input PDB file, the output DCD file containing accepted structures, files with Rg values as shown in the plot on the web-page, and run statistics.
./run_0/monomer_monte_carlo/rna_protein_complex.pdb

./run_0/complex_monte_carlo/run_0.dcd

./run_0/complex_monte_carlo/run_0.dcd.all_rg_results_data.txt

./run_0/complex_monte_carlo/run_0.dcd.accepted_rg_results_data.txt

./run_0/complex_monte_carlo/run_0.dcd.stats
The program is written so that linear polymers of proteins and single-stranded nucleic acids are simulated over a specific selection of residues in a single direction.
A solution for the best rotation to relate two sets of vectors W. Kabsch, Acta Crystallog. sect. A 32 922-923 (1976). BIBTeX, EndNote, Plain Text
A discussion of the solution for the best rotation to relate two sets of vectors W. Kabsch, Acta Crystallog. sect. A 34 827-828 (1978). BIBTeX, EndNote, Plain Text
CHARMM: The energy function and its parameterization with an overview of the program A. D. MacKerel Jr., C. L. Brooks III, L. Nilsson, B. Roux, Y. Won, M. Karplus, The Encyclopedia of Computational Chemistry, John Wiley & Sons: Chichester, 271-277 (1998). BIBTex, Endnote, Plain Text
Atomistic ensemble modeling and SANS of intrinsically disordered protein complexes: applied to MCM helicase S. Krueger, J. E. Curtis, S. Raghunandan, Z. Kelman, Biophys. J. 101, 2999-3007 (2011). BIBTex, Endnote, Plain Text
SASSIE: A program to study intrinsically disordered biological molecules and macromolecular ensembles using experimental scattering restraints J. E. Curtis, S. Raghunandan, H. Nanda, S. Krueger, Comp. Phys. Comm. 183, 382-389 (2012). BIBTeX, EndNote, Plain Text
Structural model of an mRNA in complex with the bacterial chaperone Hfq Y. Peng, J. E. Curtis, X. Fang, S. A. Woodson, Proc. Natl. Acad. Sci. USA 111, 17134-17139 (2014). BIBTex, Endnote, Plain Text