Calculates volumetric gaussian cube files from user supplied structures. These files can be subsequently rendered in VMD and Pymol.
The Density Plot module is accessible from the Analyze section of the main menu.
The purpose of the module is generate files with volumetric data to visualize results. Often, this is used to visualize sub-ensembles of structures that are in agreement with experimental data.
Typically, between 10,000 to 50,000 structures are required to enable a clear visualization consistent with adequate configuration space for most problems.
For a molecule with a single segment, the files with "complete" in the file name are identical. The files named with "region" in the name are for the regions identified by the user. For molecules with multiple segments, each will have a "complete" file with all the information for each region in that segment. Then the single, overall, "complete" file (without the a segment name) will have data from all segments with all regions.
The dimensions of the cube are automatically re-sized, if a structure doesn't fit within the input dimensions. This is done so that each structure in your input trajectory will be inside the final cube.
All cube files are normalized to account for the number of atoms. There is an option to save the raw occupancy data if users wish to process the data in a different manner.
Output file naming is discussed in the first example output section below.
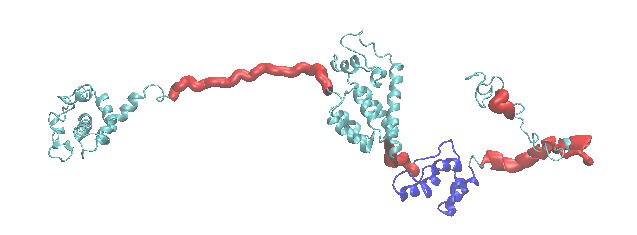
This example creates gaussian cube files sample configurations of the HIV-1 Gag protein generated in the Monomer Monte Carlo "constraints" example. The cartoon of the starting structure highlights the flexible regions (red) and structure alignment region (blue) used in the simulation.
Note that the constraints used in the example allowed the acceptance of trial configurations so that only structures with the center of mass of atoms in residues 240 to 260 were within 40.0 angstroms of the center of mass of CA atoms in residues 400 to 420 were valid.
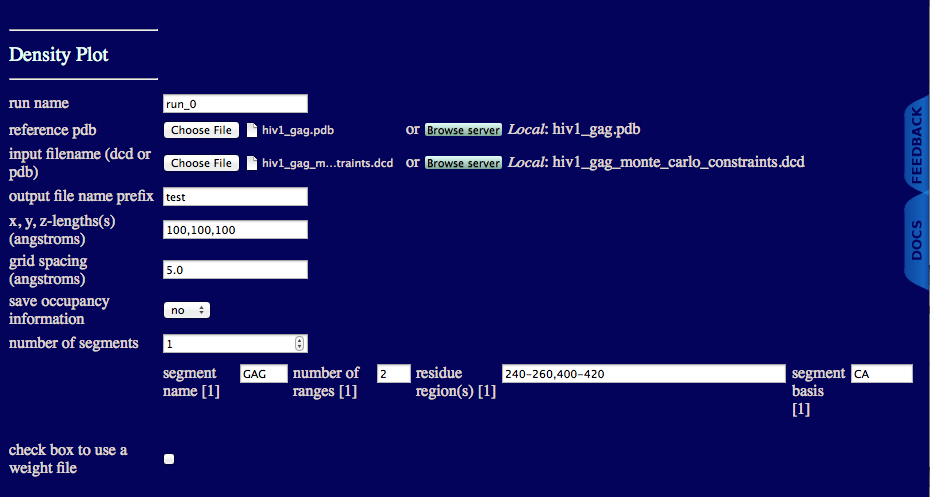
run name user defined name of folder that will contain the results.
reference pdb PDB file with naming information and coordinates of the starting structure.
input filename (dcd or pdb): DCD or PDB file with coordinates that will be used to create gaussian cube files.
output file name prefix Unique text to insert in output file names.
x,y,z-length(s) (angstroms) Estimate of the size of overall cube to contain your molecule. Note, box will re-size to fit all structures in your trajectory if the input values are too small.
grid spacing (angstroms) Cubic length of each voxel.
save occupancy information Choose to keep non-normalize occupancy values for each voxel.
number of segments An integer value indicating the number of segments in molecule.
segment name Name of particular segment.
number of ranges An integer value indicating the number of regions to create independent gaussian cube files.
residue region(s) Residue numbers defining each region in segment. The number of pairs should match the number of regions for the given segment. Pairs of integers separated by hypens with each pair separated by commas.
segment basis Name of the atom to use to determine if a voxel is occupied.
check box to use a weight file
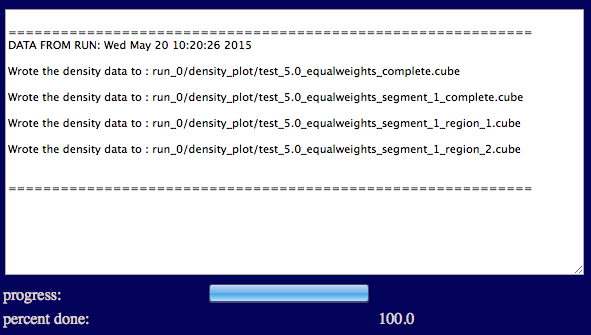
The output will indicate the list of files that were written to disk.
Results are written to a new directory within the given "run name" as noted in the output.
Several files are generated and saved to the "run name" density_plot directory.
run_0/density_plot/test_5.0_equalweights_complete.cube

run_0/density_plot/test_5.0_equalweights_segment_1_complete.cube

run_0/density_plot/test_5.0_equalweights_segment_1_region_1.cube

run_0/density_plot/test_5.0_equalweights_segment_1_region_2.cube
Output file naming
The general recipe is:
"output file name prefix_"grid spacing"_"weight file flag"_segment_"segment number"_region_"region number".cube
In this example:
output file name prefix : test
grid spacing: 5.0
equal weight file not used:equal_weights
1 segment in molecule: 1
2 regions in segment: region_1
region_2
Region_1 : 240-260
Region_2 : 400-420
This allows one to experiment with different conditions and keep similar files organized.
In the figure below the envelope sampled by all accepted structures is shown along with smaller envelopes described below. The envelopes were visualized using VMD. Three envelopes are displayed in the figure. The blue mesh represents all atoms for each frame of the trajectory, the red mesh represents only CA atoms in region 1 (resid 240-260), and the solid purple mesh represents only CA atoms in regions 2 (resid 400-420).
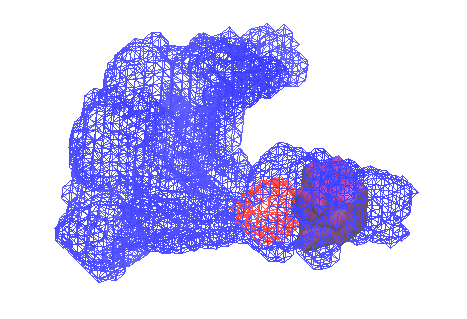
A step by step guide to create this figure using VMD is found in the VMD visualization of gaussian cube files: Example 1 page.
input files
output files
test_5.0_equalweights_complete.cube
test_5.0_equalweights_segment_1_complete.cube
test_5.0_equalweights_segment_1_region_1.cube
test_5.0_equalweights_segment_1_region_2.cube
Module creates output files that are visualized using other program(s) as there are no visualization options built into sassie-web.
VMD - Visual Molecular Dynamics W. Humphrey, A. Dalke, K. J. Schulten, Molec. Graphics, 14, 33-38 (1996). BIBTeX, EndNote, Plain Text
SASSIE: A program to study intrinsically disordered biological molecules and macromolecular ensembles using experimental scattering restraints J. E. Curtis, S. Raghunandan, H. Nanda, S. Krueger, Comp. Phys. Comm. 183, 382-389 (2012). BIBTeX, EndNote, Plain Text